A spectrum analyzer is one of the most valuable tools for sound engineers, music producers, and mastering engineers. It shows how the loudness of a signal changes across different frequencies, helping you hear with your eyes.
Yes, in music production your ears are your primary tool, but visual analysis can reveal things that are hard to hear — unwanted resonances, noise, frequency imbalances, and more.
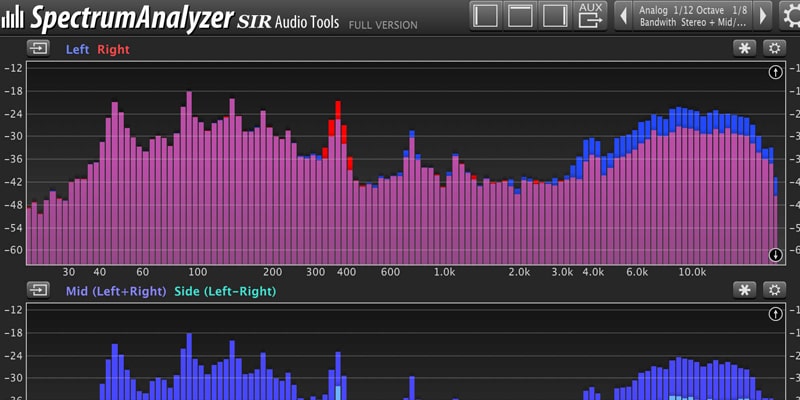
How to Read a Spectrum Analyzer Graph
The display has two axes:
- Horizontal (X) — frequency in Hertz (Hz), from 20 Hz to 20,000 Hz (the full range of human hearing).
- Vertical (Y) — amplitude (loudness) in decibels (dB).
On the graph, you can see:
- Peaks — areas with energy buildup at certain frequencies.
- Dips — areas with a lack of energy.
- Harmonics, distortion, bandwidth, and other details not visible in a regular waveform.
Key Settings for Accurate Interpretation
1. Slope/Tilt
Determines how fast the curve drops per octave.
- –3 dB/octave — mimics pink noise, close to how our ears perceive sound.
- –4.5 dB — another common choice.
- 0 dB — best for precise analysis of a narrow range (e.g., sub-bass).
2. Resolution Bandwidth (RBW)
Affects how close two peaks can be for the analyzer to detect them separately. Lower RBW = better detail and lower measured noise.
3. Video Bandwidth (VBW)
Smooths the display by removing noise from the curve. Narrower VBW = cleaner, more readable visuals.
4. Detector Types
- Sample — takes the middle point of the interval.
- Peak — shows the loudest point.
- Average — averages all points in the interval.
Where and Why to Use a Spectrum Analyzer
1. Music Production
- Detecting unwanted low-frequency rumble or noise.
- Balancing bass notes.
- Spotting unwanted resonances.
- Managing high-frequency content.
- Identifying the signal’s fundamental frequency for precise EQ.
2. Room Acoustics
- Analyzing uneven bass response caused by standing waves.
- Measuring the room’s frequency response (using tools like REW, Sonarworks).
3. Monitoring
- Checking low-end frequencies your monitors may not reproduce.
- Finding hidden hum or noise.
4. Referencing
- Comparing your mix’s spectrum to a reference track.
- Identifying frequency imbalances.
- Using plugins like Metric AB for quick A/B switching.
5. Other Fields
- RF (Radio Frequency) — measuring signals and identifying interference.
- Audio — harmonic analysis and feedback detection.
- Optics & Vibration — separating light wavelengths and analyzing mechanical oscillations.
Final Tip
A spectrum analyzer is a powerful visual tool, but it should complement your ears, not replace them. Use it to confirm what you hear and to find hidden issues — but always trust your final judgement to your listening skills.
Rate this post along with 0 others